Greta recently began a new position as postdoctoral researcher at BC3 Basque Centre for Climate Change in the Leioa, near Bilbao, Spain. As a research center BC3 is entirely focused on the investigation of climate change phenomena providing support and tools for policy-makers.
She is part of research line 5. “Integrated Modelling of Coupled Human-Natural Systems” contributing to the ARIES (ARtificial Intelligence for Environment & Sustainability) platform and its k.LAB software. ARIES facilitates interoperable and integrated data and modelling using Artificial Intelligence techniques (e.g. machine reasoning) to promote open knowledge for decision-making. In her capacity as ontologist Greta is working on the semantic levels of ARIES.
We’re very proud that Greta can be part of the research team have the opportunity to work in such a group of passionate experts!
Conceptual Integration for Social-Ecological Systems
An ontological approach
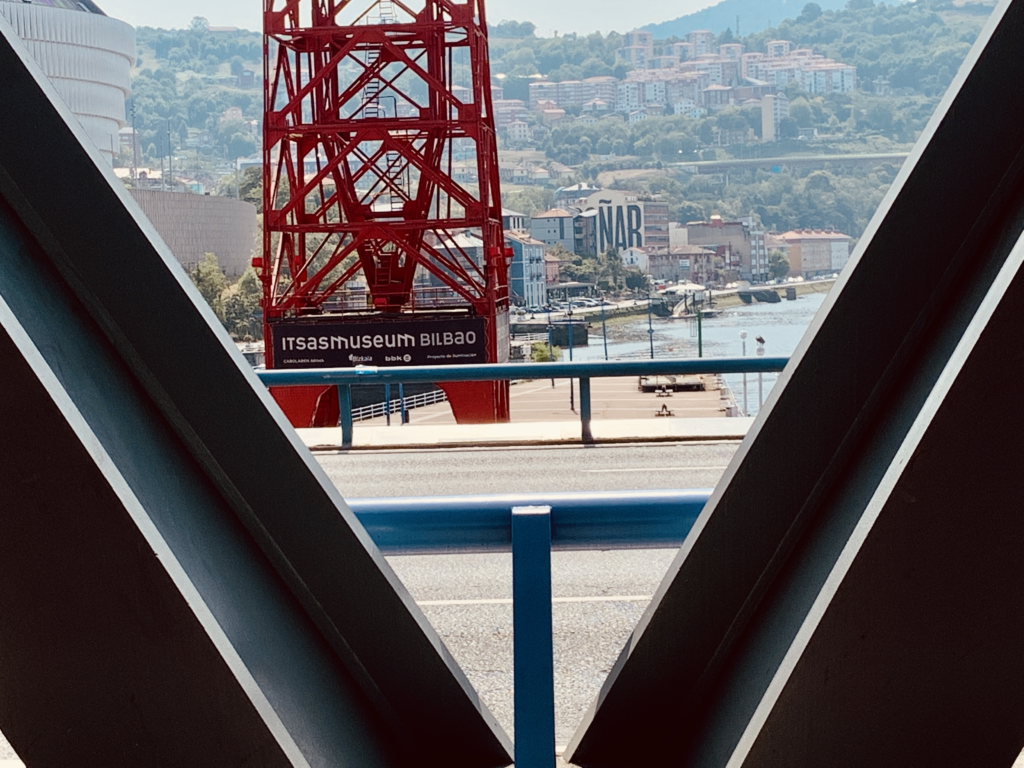
The paper “Conceptual Integration for Social-Ecological Systems: An Ontological Approach”, which demonstrates an application of ontological analysis in the sustainability context, has been accepted and presented at the 16th International Conference on Research Challenges in Information Science (RCIS 2022).
The paper proposes an ontological clarification and a conceptual integration of two social-ecological systems framework elements, social-ecological system framework [3] and ecosystem services [1, 5]. Many are the discussed elements, ranging from governance, ecosystem services, values and benefit, and several are the referenced ontologies and ontological studies that we adopted for the clarification, e.g. Descriptive Ontology for Linguistic and Cognitive Engineering (DOLCE) [2] and Unified Foundational Ontology (UFO) [5].
With this paper we hope to foster a discussion across communities (e.g. ecology, economics, applied ontologies, conceptual modelling and information systems). Many are the possible future works, so we are open to receive feedback!
References:
[1] Assessment, M. E. (2005). Ecosystems and human well-being.
[2] Masolo, C., Borgo, S., Gangemi, A., Guarino, N., Oltramari, A.: WonderWeb de- liverable D18 ontology library (final). Tech. rep., IST Project 2001-33052 Wonder- Web: Ontology Infrastructure for the Semantic Web (2003)
[3] McGinnis, M. D., & Ostrom, E. (2014). Social-ecological system framework: initial changes and continuing challenges. Ecology and society, 19(2).
[4] Guizzardi, G., Botti Benevides, A., Fonseca, C.M., Porello, D., Almeida, J.P.A., Prince Sales, T.: Ufo: Unified foundational ontology. Applied Ontology 17, 1–44 (2021)
[5] Potschin, M., & Haines-Young, R. (2016). Defining and measuring ecosystem services. Routledge handbook of ecosystem services, 25-44.
During the conference were discussed several important topics, including gender equality within the field. For example, Prof. Dr. Florence Sèdes from IRIT – Université Toulouse III – Paul Sabatier presented a keynote entirely dedicated to the debate on fairness, diversity and non-discrimination in Information Science. The dimension of gender was also included in one or the RCIS workshops called “1st Workshop on Ethical, Social and Environmental Accounting of Conferences: the case of RCIS 2022“.
At the conference we had the chance to informally introduce Mind the Gap (MtG), a co-created board game developed by Max during his PhD.
MtG is a partecipatory game that facilitates data collection and dialogue through role-playing and intersubjective dynamics. An exhaustive description of MtG can be found in Max’s thesis.
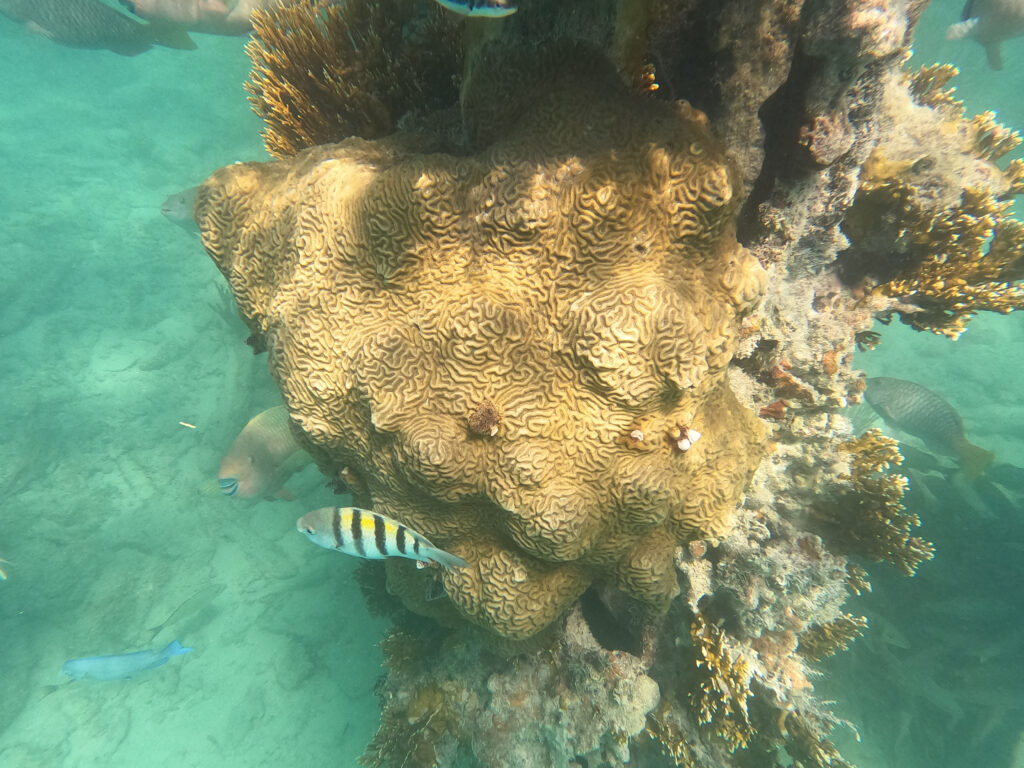
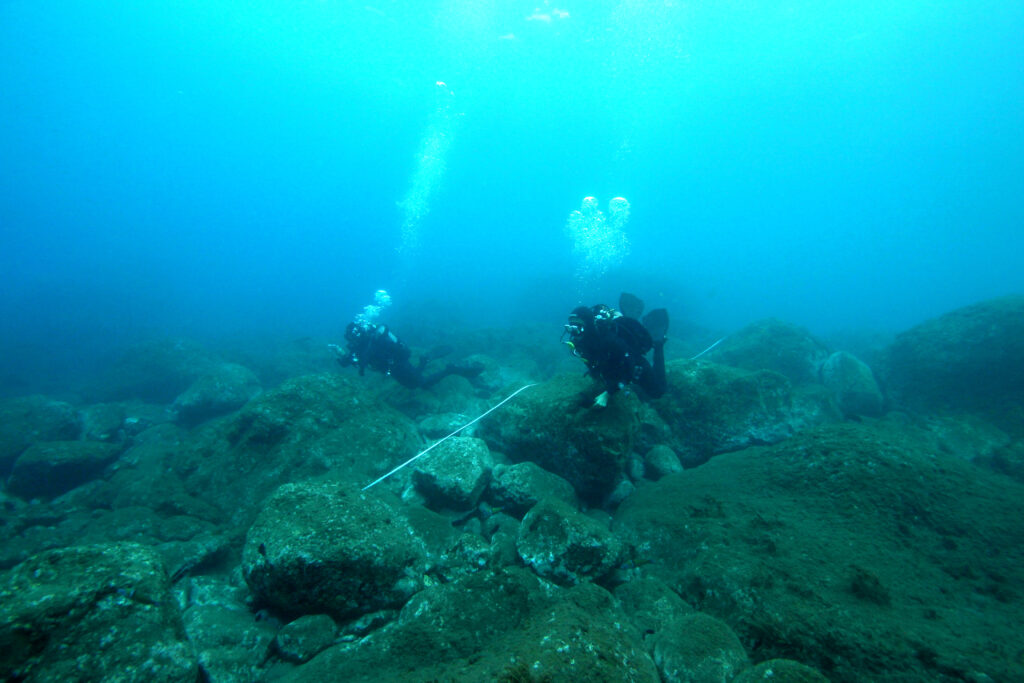
We surveyed the underwater area of Pt. do Lazareto using quadrats every 5 m. on 50 m. transect and visual census. The goal of the study was to identify: (i) the sessile and (ii) the coastal fish species in order to later compare the findings with other areas of the same dive site. Indeed the site despite being relatively small, it presents different characteristics due to environmental conditions (e.g., entering of fresh water in the sea and presence of more wave in certain areas of the coast).
The team was composed of Max, Catarina and myself and we organised the dive by allocating different tasks to each of the members. For example, while I was placing the quadrats along the transect, Catarina was performing the visual count of the sessile organisms and Max was operating the underwater camera. The coastal fishes’ visual census was executed while going back on the transect by two divers while the third was assigned to situational awareness.
Special thanks to Instituto das Florestas e Conservação da Natureza (IFCN)!
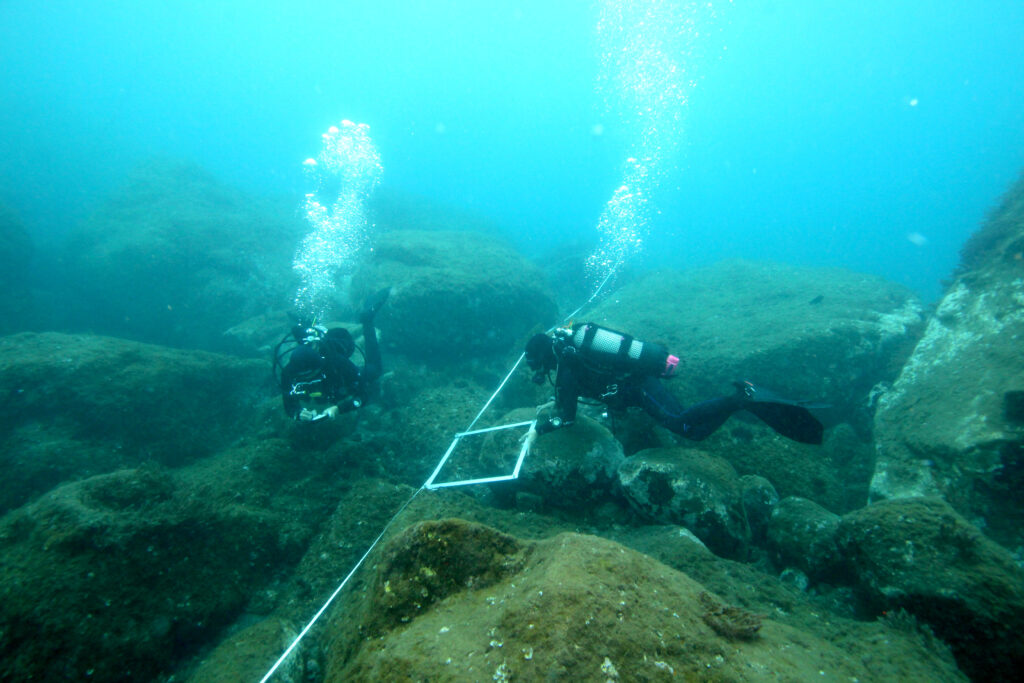
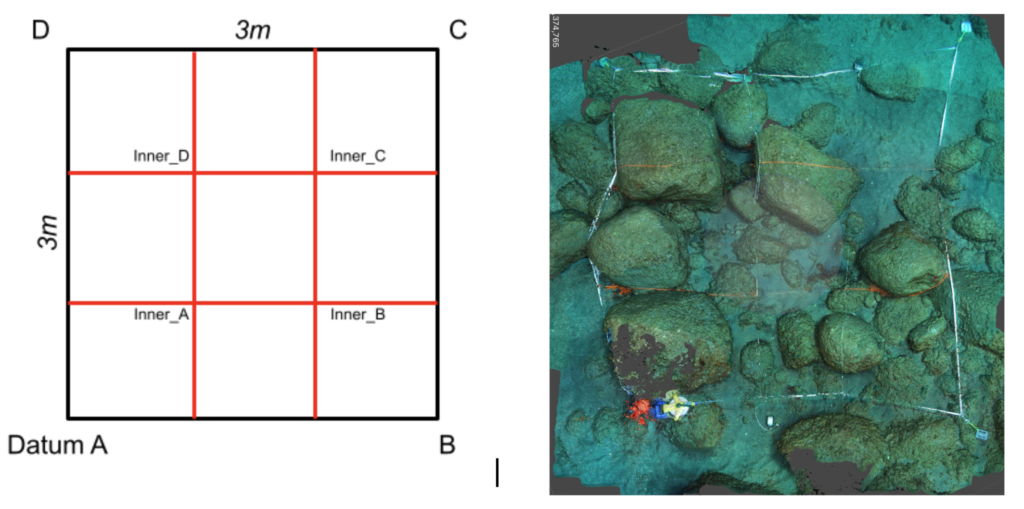
This week in Madeira we completed a scientific diving course from Center for Marine Sciences (CCMAR) part of the University of the Algarve system. The course lasted four days, in which we reviewed a range of scientific practices from developing research questions, selecting study methods, sampling design, dive planning, team and equipment preparation, underwater survey and sampling and report development. Under the guidance of an excellent trainer Diogo Paulo and together with another teammate, we practiced a variety of survey and sampling techniques such as site sketching, radial search, visual, photographic and video survey using quadrats, transect lines, grid plots and more. As always, our teamwork got better over the course of the class, we became more efficient doing the tasks.
We will be able to apply these skills to many different aspects of our work, and would really like to thank ARDITI, FCT, CCMAR, and Madeira Divepoint for facilitating the class, and especially Diogo Paulo for having the patience to train us up!
We will of course, need to practice laying grid lines, and try to make them more even!
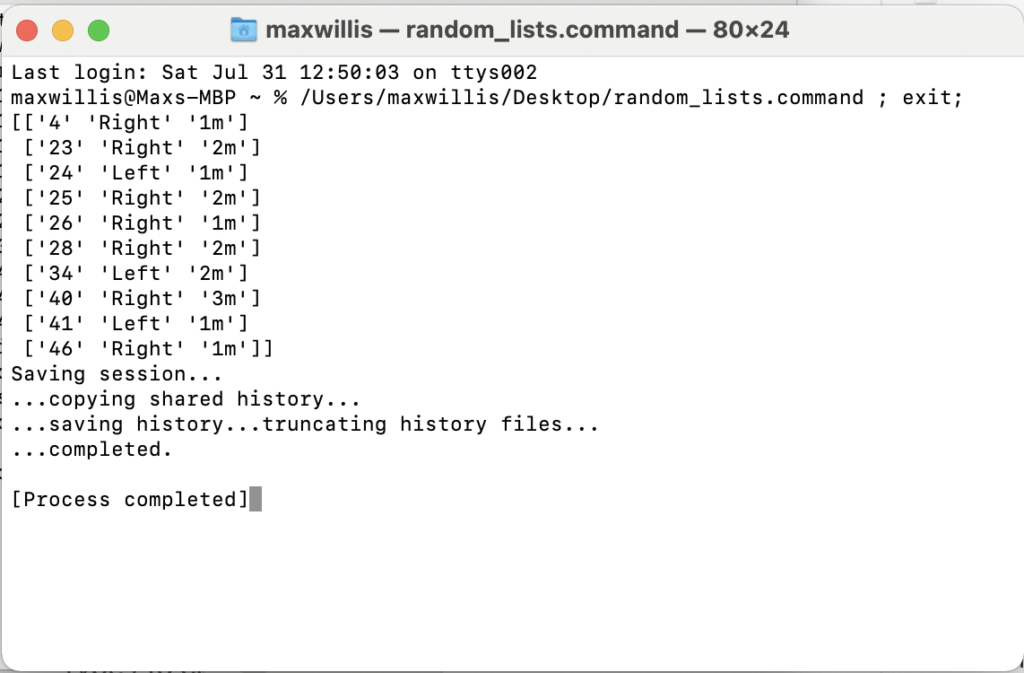
When taking samples or deciding which places to record observations, for example along a transect line, we need sometimes to choose sites randomly. Imagine a transect line that’s 50 meters long, and we want to take samples at random intervals, either left or right and between one and three meters of the transect line. A very efficient way to do this is using a short python script.
The following python code creates three lists, one for the direction of offset left and right, one list with the distance of offset, and one choosing a random distance along the transect. These lists are then stacked and sorted, giving in this example 10 random samples along a 50m transect.
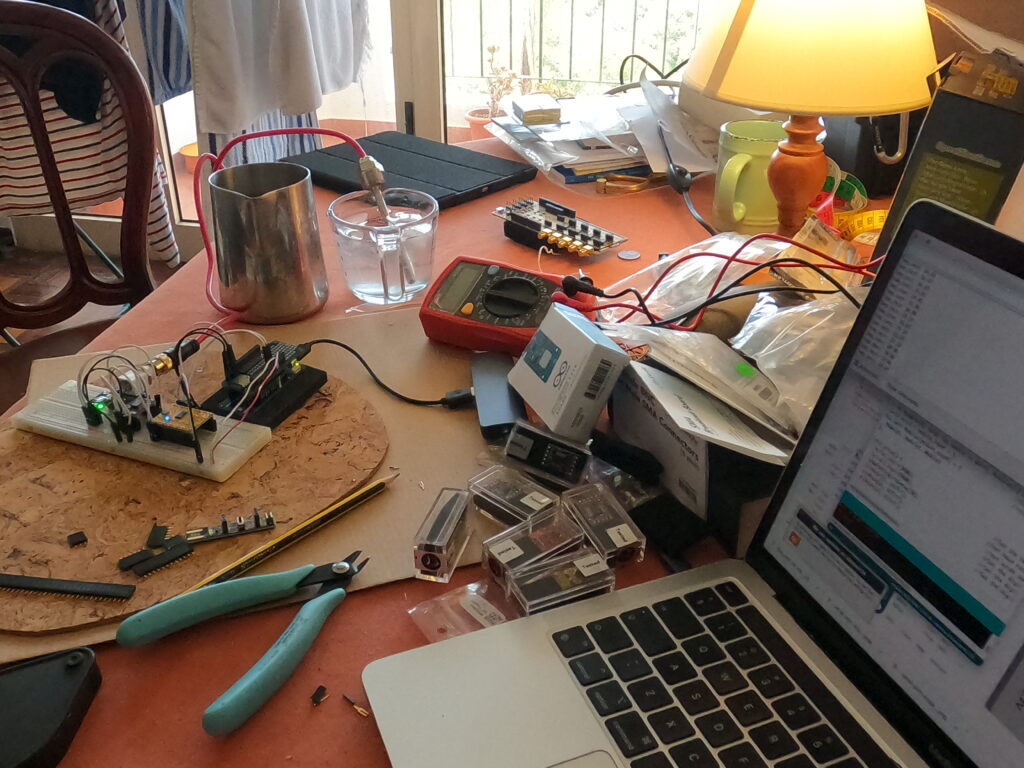
Today we had a look at some of the internals for the next phase of the data buoy project, water quality sensing. This is an extension of the wave dynamics monitoring, and in this first session we laid out the circuitry for one of the four Atlas Scientific sensors from whitebox.ch we will be using, with an Arduino MKR LoRa board.
We placed all the components for one sensor circuit on the breadboard, and wired up a serial multiplexer, that’s the yellow circuit with the blue light in the photo, which allows us to read up to 9 sensors on one serial (tx/rx) connection to the Arduino. The sensor and circuits worked just fine, and we were able to begin logging the data to a .csv file on the SD card, with just a few changes to the sample code. A latte frothing pitcher full of hot water and measuring cup with ice water served as an extreme ocean stratification test!
For the moment only two ports on the multiplexer are reading (the same thermometer) and the GPS latitude and Longitude, speed and epoch time are just dummy data. But since we have the GPS circuit, solar power and sunnybuddy charger all set up, it’ll be straightforward to put them all together for a proper test.
Next up: Ph, Salinity (electroconductivity), and Dissolved Oxygen sensors, plus a depth sensor…
Congratulations team on a successful test of the latest version 3 of our databuoy!
Still waiting to see the results of the wave data and compare (validate) with the pressure recording device, but during the test deployment, seeing the average wave heights and direction coming off the buoy, to the wireless receiver, transferred through the institute server, and displayed on a mobile phone screen back on site was impressive!
It’s the culmination of a year from when we first discussed the project, to fully functional prototype, with all the hard work, lessons learned, trial and error and eventual success, and it’s solid evidence for the viability of Speculative Design not only as fictions that imagine potential futures, but through backcasting, to facilitate real-world technology design and development, shaping our Preferred Futures.
Thanks everyone who has been helping and encouraging so far, especially project engineers Victor Azevedo and Vitor Aguiar, as well as Carlos Freitas and the IFCN, Marko Radeta, Jorge Lopes, Joao Monteiro, Rodrigo Silva and many others!
Our current project in Madeira (see https://islandfutures.net/databuoy/) involves quite a lot of diving plans and subsurface activity in the test site at Ponta do Lazareto, Madeira. Some tasks are simply manual labor underwater, but we consider it all ‘scientific diving’ as the diving is a tool for our research. There are two main entries and exits to the site, one is part of a historic jetty with stairs that facilitate the access to the water, and the other is a rocky beach (see Fig. 1). Initially our dives at Ponta do Lazareto had the goals of familiarisation of the site, depth mapping, and installing buoy moorings. Next steps include video and photo transects to record flora and fauna, and photogrammetry of seabed morphology.
Fig. 1 Ponta do Lazareto site (thanks to IFCN)
We typically dive once or twice in a day using Nitrox 32 in a maximum depth of 15 meters. We differentiate research project dives from our other recreational dives, and we created a specific logbook (see below) that contains the additional information concerning the dives.
Dive planning is important, so before entering in the water we establish the details for the upcoming dive. Safety is the keyword! We have trained to GUE standards and usually follow the pre-dive checklist proposed by GUE, most importantly we discuss the goal(s) of the dive and each team member’s responsibilities and their tasks. Creating a list of all the extra equipments (e.g., ropes, measure tape, buoys, lift bags, cameras) required for the dive help (Max) not to forget those items. The other important aspect we never miss is equipment match, before immersion we double check each diver’s equipment again. If there are complex manoeuvres or specialised tasks to perform, we will simulate the activity above water and adjust the choreography for efficiency.
Concerning the dive execution, we stick to the plan as closely as possible, each performing the assigned tasks to achieve the team goal. So far so good, yet the underwater world can “surprise” in many different ways, for instance poor visibility complicates the fulfilment of some activities. Realising how much longer it takes to complete each task underwater can cause stress and dives with unfulfilled goals. So learning as much as possible our dive site and regularly testing our capabilities is important to predict many challenging situations.
Fig. 3 Adding an extra hose for the lift bag
Again, planning is important, as well as having appropriate equipment. It might happen that a piece of gear selected for the dive is not adequate, for example we realised that the extra hose to fill a lift bag was too short, might create a potential hazard, and needed to be replaced. Or as we realised on our last excursion, we really need an underwater equipment bag to keep everything together, as things tend float to the surface unattended. Because we work on very slim budget, we make a lot of equipment ourselves; this can be useful as we can fully customise each piece, but in the end it might not be cheaper than buying commercial gear, if we counted all of our labour hours!
We recently completed the course Scientific Diver at CCMAR in Faro, Portugal. Looking forward to continue this activity!